Link copied
The Likelihood of a Stock Market Crash Taking Shape Under President Donald Trump Is Rising -- and There's a Clear Reason Why.
stock :: 10hrs ago :: source - motley fool
By Sean Williams
From a purely statistical standpoint, investors have prospered under President Donald Trump. During his first, non-consecutive term (Jan. 20, 2017 – Jan. 20, 2021), the widely followed Dow Jones Industrial Average (DJINDICES: ^DJI), benchmark S&P 500 (SNPINDEX: ^GSPC), and growth-stock-inspired Nasdaq Composite (NASDAQINDEX: ^IXIC) gained 57%, 70%, and 142%, respectively.
The first year of Trump's second term was much of the same, with all three major stock indexes rallying by double digits.
Will AI create the world's first trillionaire? Our team just released a report on the one little-known company, called an "Indispensable Monopoly" providing the critical technology Nvidia and Intel both need. Continue »
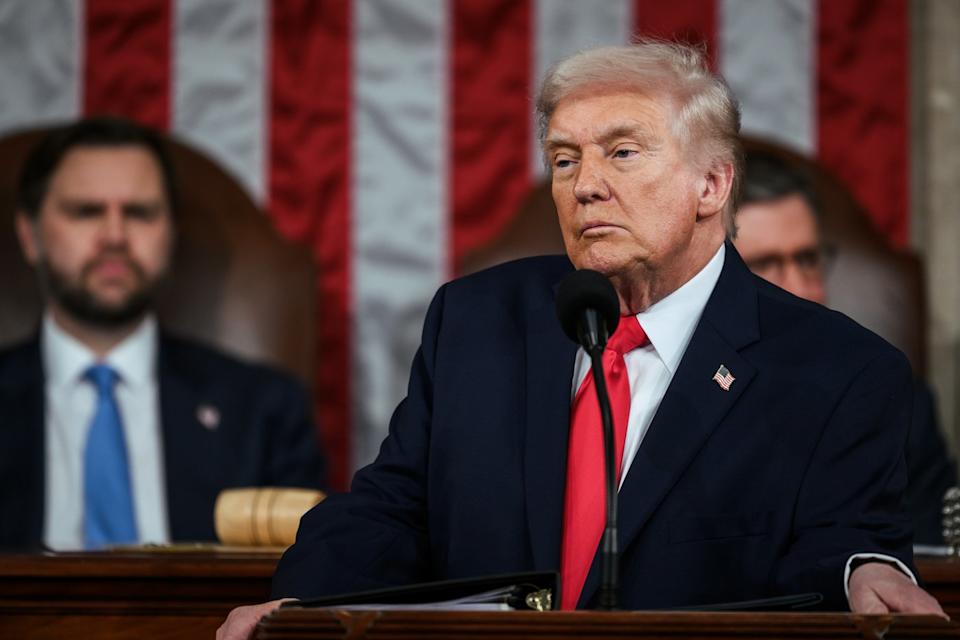 President Trump delivering the State of the Union address. Image source: Official White House Photo by Daniel Torok.
But the Dow, S&P 500, and Nasdaq Composite have hit a snag over the last six weeks. Both the Dow and Nasdaq briefly entered correction territory, while the pullback in the benchmark S&P 500 had it knocking on the door of a double-digit decline. This reversal of fortune has some investors pondering whether a stock market crash will take shape under President Trump.
While nothing can be answered with concrete certainty, one catalyst strongly suggests the likelihood of an elevator-down move for stocks has notably increased.
Wall Street's historically pricey stock market has been waiting for a catalyst
Entering 2026, arguably the biggest headwind for Wall Street was the historical priciness of the stock market. The S&P 500's Shiller Price-to-Earnings (P/E) Ratio was above 40, and the only two previous occurrences of a Shiller P/E above 40 were followed by losses of 49% (the dot-com bubble) and 25% (the 2022 bear market) on a peak-to-trough basis in Wall Street's benchmark index.
S&P 500 Shiller PE Ratio hits 2nd highest level in history 🚨 The highest was the Dot Com Bubble 🤯 pic.twitter.com/Lx634H7xKa
— Barchart (@Barchart) December 28, 2025
In other words, history has shown that extended valuations aren't well tolerated by investors over the long term. But a catalyst was missing that could send the stock market over its tipping point. Thanks to the Iran war, this catalyst is front and center.
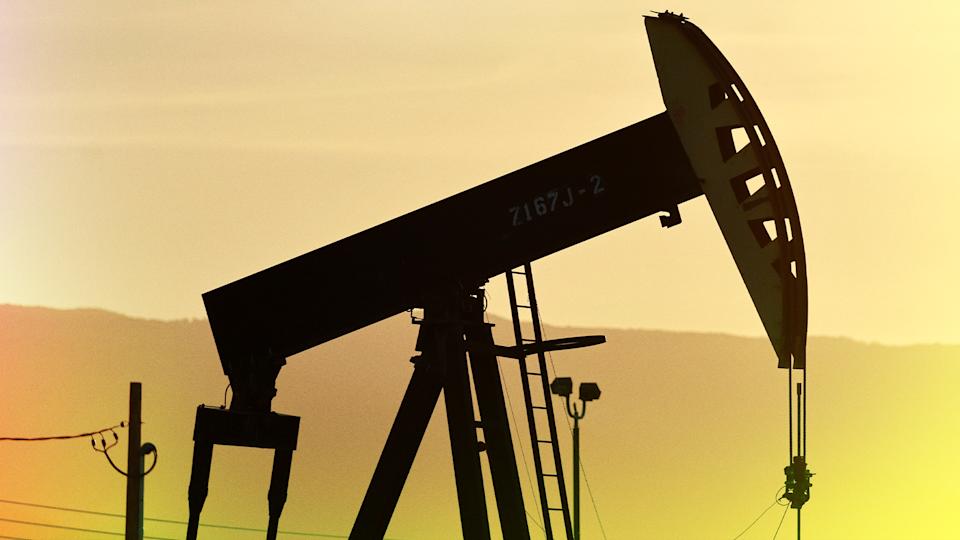
Shortly after military operations began against Iran on Feb. 28, the Strait of Hormuz was closed to virtually all oil exports. This disrupted approximately 20% of the world's daily liquid petroleum demand and sent crude oil prices skyrocketing to the heavens.
While most consumers are feeling the pinch of higher prices when they fuel up their car, truck, or SUV, higher energy commodity prices have broad-reaching implications for the U.S. economy. Higher petroleum prices can increase transportation and production costs for most sectors and industries.
According to the Federal Reserve Bank of Cleveland's Inflation Nowcasting projection, the trailing 12-month inflation rate is estimated to jump from a reported 2.4% in February to 3.25% in March, based on estimates as of April 3. This is a mammoth increase from the previous month and would represent the 60th consecutive month that U.S. inflation has exceeded the Fed's long-term target of 2%.
 Fed Chair Jerome Powell delivering remarks. Image source: Official Federal Reserve Photo.
A Federal Reserve about-face can pull the rug out from beneath an expensive stock market
If the Iran war is the spark, America's foremost financial institution, the Federal Reserve, is the fire that's capable of quickly upending the bull market under Donald Trump.
Several factors have propelled Wall Street's historically expensive stock market higher, including the artificial intelligence (AI) revolution, the advent of quantum computing, and the prospect of several rate cuts by the central bank in 2026 (if not beyond). Lower interest rates make borrowing less costly, which is highly attractive for companies building AI-accelerated data centers.
But what if the Fed did a complete 180?
Based on what history tells us, oil price shock events don't resolve overnight. Whereas oil price shocks typically result in swift increases in fuel prices, it often takes several quarters for prices to decline after the worst has passed. This is to say that the sizable uptick in inflation for March is likely to persist, if not further accelerate, in April and beyond.
The impetus for the Federal Open Market Committee (FOMC) -- the 12-person body, including Fed Chair Jerome Powell, responsible for setting the nation's monetary policy -- to continue its rate-easing cycle has effectively vanished.
The problem for Wall Street isn't just that the FOMC could slam on the brakes following the March inflation report. It's that Powell and his voting peers may put the possibility of rate hikes back on the table. Raising interest rates amid a historically expensive stock market would meaningfully increase the likelihood of a stock market crash under President Trump.
Wall Street's silver lining
Admittedly, the prospect of an elevator-down move in stocks tends to scare investors. Thankfully, there's a silver lining for optimists who take a long-term approach.
On the one hand, stock market corrections, bear markets, and even crashes are normal and inevitable events. No amount of maneuvering by the federal government or central bank can stop these often emotion-driven downturns.
What's of particular interest with corrections, bear markets, and stock market crashes is how quickly they typically resolve. Two of the more recent crash events (the COVID-19 crash and the tariff tantrum) lasted just 33 calendar days and less than one week, respectively. While volatility can persist for weeks or months, the peak-to-trough decline during a stock market crash often occurs rather quickly.
More importantly, stock market cycles aren't linear.
The current bull market -- the "AI Bull" -- has eclipsed the 1,200-day mark. This is the 10th bull market to last 1,000+ days based on the 20% rally/decline threshold.
— Bespoke (@bespokeinvest) February 10, 2026
Bear markets, on average, are much shorter, at just 286 days, with the longest being 630 days back in… pic.twitter.com/ds7lqWWHFh
A data set published on X (formerly Twitter) by wealth management firm Bespoke Investment Group compared the length of every S&P 500 bull and bear market since the start of the Great Depression (September 1929). At one end of the spectrum, the average of 27 S&P 500 bear markets found its bottom in 286 calendar days, or roughly 9.5 months.
In comparison, the average S&P 500 bull market has persisted for 1,011 calendar days over the last 96 years, with more than half lasting longer than the lengthiest bear market (630 calendar days).
If a stock market crash does take shape under President Donald Trump, history makes clear that it would be an opportune time for optimistic long-term investors to pounce. While volatility might persist for months, the long-term trajectory for the Dow Jones Industrial Average, S&P 500, and Nasdaq Composite points higher.
Should you buy stock in S&P 500 Index right now?
Before you buy stock in S&P 500 Index, consider this:
The Motley Fool Stock Advisor analyst team just identified what they believe are the 10 best stocks for investors to buy now… and S&P 500 Index wasn’t one of them. The 10 stocks that made the cut could produce monster returns in the coming years.
Consider when Netflix made this list on December 17, 2004... if you invested $1,000 at the time of our recommendation, you’d have $550,348!* Or when Nvidia made this list on April 15, 2005... if you invested $1,000 at the time of our recommendation, you’d have $1,127,467!*
Now, it’s worth noting Stock Advisor’s total average return is 959% — a market-crushing outperformance compared to 191% for the S&P 500. Don't miss the latest top 10 list, available with Stock Advisor, and join an investing community built by individual investors for individual investors.
*Stock Advisor returns as of April 11, 2026.
Sean Williams has no position in any of the stocks mentioned. The Motley Fool has no position in any of the stocks mentioned. The Motley Fool has a disclosure policy.
This article was originally published by The Motley Fool
This week top market trends.
-
Tencent's quarterly revenue rises 13% on gaming, AI demand
2026-03-18 :: companies :: reuters -
March jobs report to show updated view of fragile labor market as war unfolded
2026-04-03 :: general :: yahoo finance -
Oil surges and US stock futures fall after Trump offers no clear timeline to end war in Iran
2026-04-02 :: commodities :: yahoo finance

Recent global market news
-
Mortgage rate predictions for the next 5 years: What experts -- and AI -- forecast through 2030
2026-04-07 :: :: yahoo finance -

Snap Stock Hits New 52-Week Low as Social Media Shares Plunge. Should You Buy the Dip?
2026-03-27 :: :: barchart